
Make a Uk map
The purpose of this tutorial is to show you how to display various statistics such as average Age or total income in a UK map, if we know the Postcode. This is a new feature in kazAnova Light and can only be accessible with version 2.00.
The first thing to do is to download the new version of kazAnova Light (2.00) from here and install it. Then you need to get the file we will use in this tutorial. You may download it from here and then extract it anywhere you like. Bear in mind that all the variables are generally random, but were slightly changed in order to create a story which has nothing to do with reality.
Let’s assume that this file belongs to a marketing company and has some details about its customers. The file includes the following:
1) Postcodes: The first 2 letters of UK Postcodes (even if you put the whole postcode, it still reads only the first 2 letters).
2) Age: of the customers in years.
3) Years: that the customers were using the products of the company’s clients.
4) Frequency: by which the customers are buying products in days.
5) Income: in British pounds.
6) Probability: to buy a new product that one of the clients of the company is launching. This probability is derived through prediction modeling.
First Thing we need to do is open KazAnova Light (double click on the icon in desktop). Then choose File-->Open![]() -->
-->![]() .txt and select the file you just downloaded called Uk_map_sample.txt. and press Open. See the screen below:
.txt and select the file you just downloaded called Uk_map_sample.txt. and press Open. See the screen below:
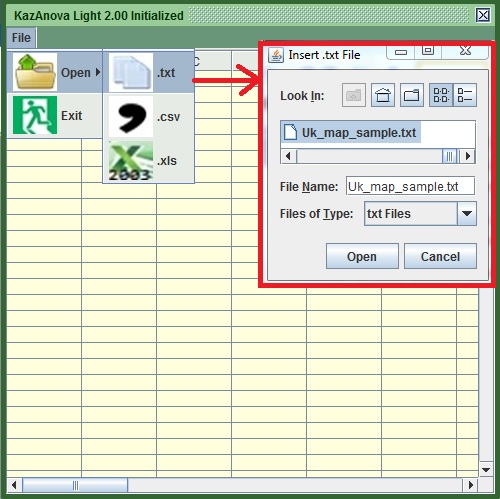
Image: KazAnova's light 2.00 import file screen
Then you will see the following screen with the data and all the variables imported in the table:
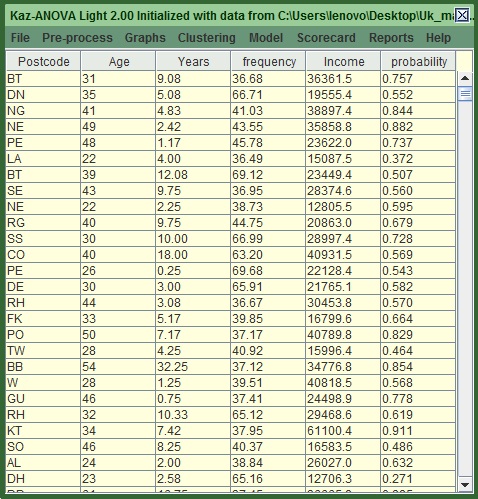
Image:Imported data
Let’s try to open the map menu now. Go to Graphs-->![]() Maps:
Maps:
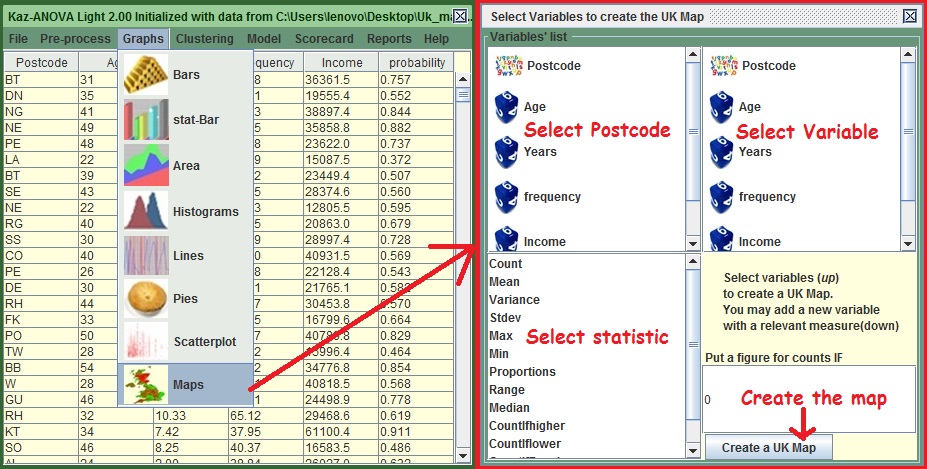
Image: Map's Menu
You will see the following window (on the right). The upper left area is to select the postcode variable. The Right upper is to select a variable as measure (e.g. select variable to see the age). However if you select a variable in the upper right, you need to select a type of statistic in the lower left part (e.g. the mean, so that you can see the mean of age via postcode).
Shall we start with our first example? To start with the simplest of all, select the postcode variable in the left column (by clicking on it) and press the ‘Create a Uk Map’ button from the right down button. See below:
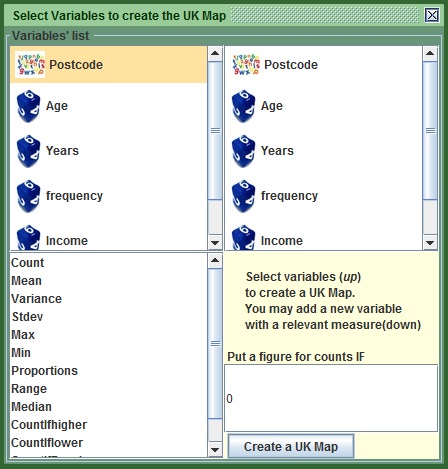
Image:Select Postcode to draw a map that displays counts
The Map will appear. The more reddish areas, indicate higher value (e.g. there are more people from this postcode). You will notice that when you point the mouse to a postcode, you can see its value and name in the upper left corner of the window. The design will be improved in later releases. It is also possible that these values do not appear at all depending on the version of windows that you have. From the map you can see that most customers come from the BT postcode (Northern Ireland) and Birmingham. Also in the areas around the midlands there are many customers. On the other hand, the company does not have a very strong influence in Scotland.
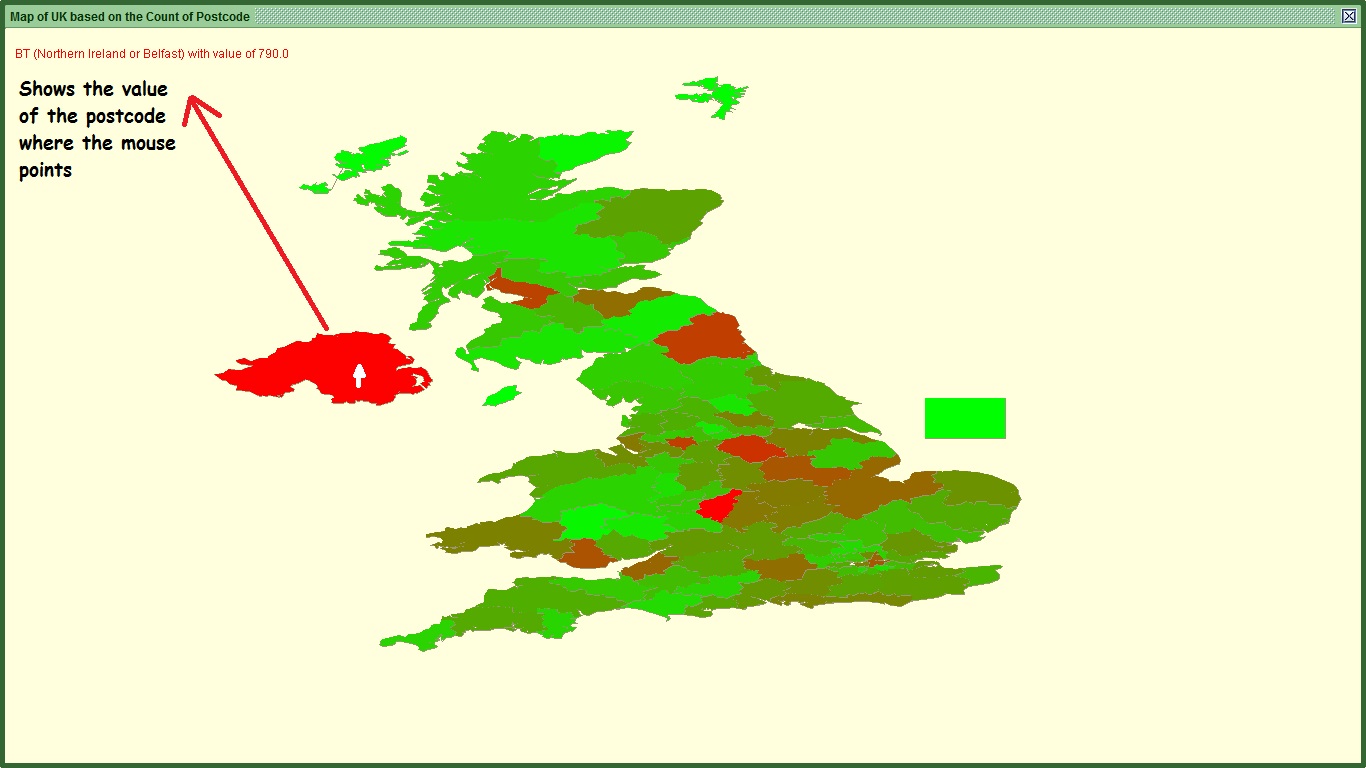
Image:Map of Uk that displays counts
Now let’s try to see the average age of each postcode in order to help the company understand more about the demographics of each postcode. Close the map.
From the map menu select postcode on the upper left corner. Select Age in the upper right corner and mean in the lower left corner and press the button like the way I ‘ ve done it below:
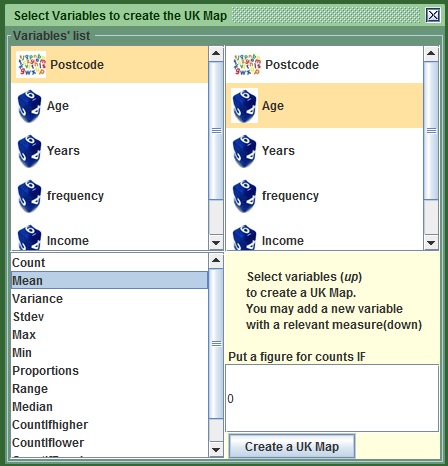
Image:Select Age to draw the map
Notice that in the new map there are a few ‘white’ arrears . This happens because the result is null (e.g the age could not be computed). You will also notice that northern areas have on average higher age. Now if you correlate this with the previous map that northerner areas had fewer customers, you may infer that the product of the company is mostly suitable for younger people.
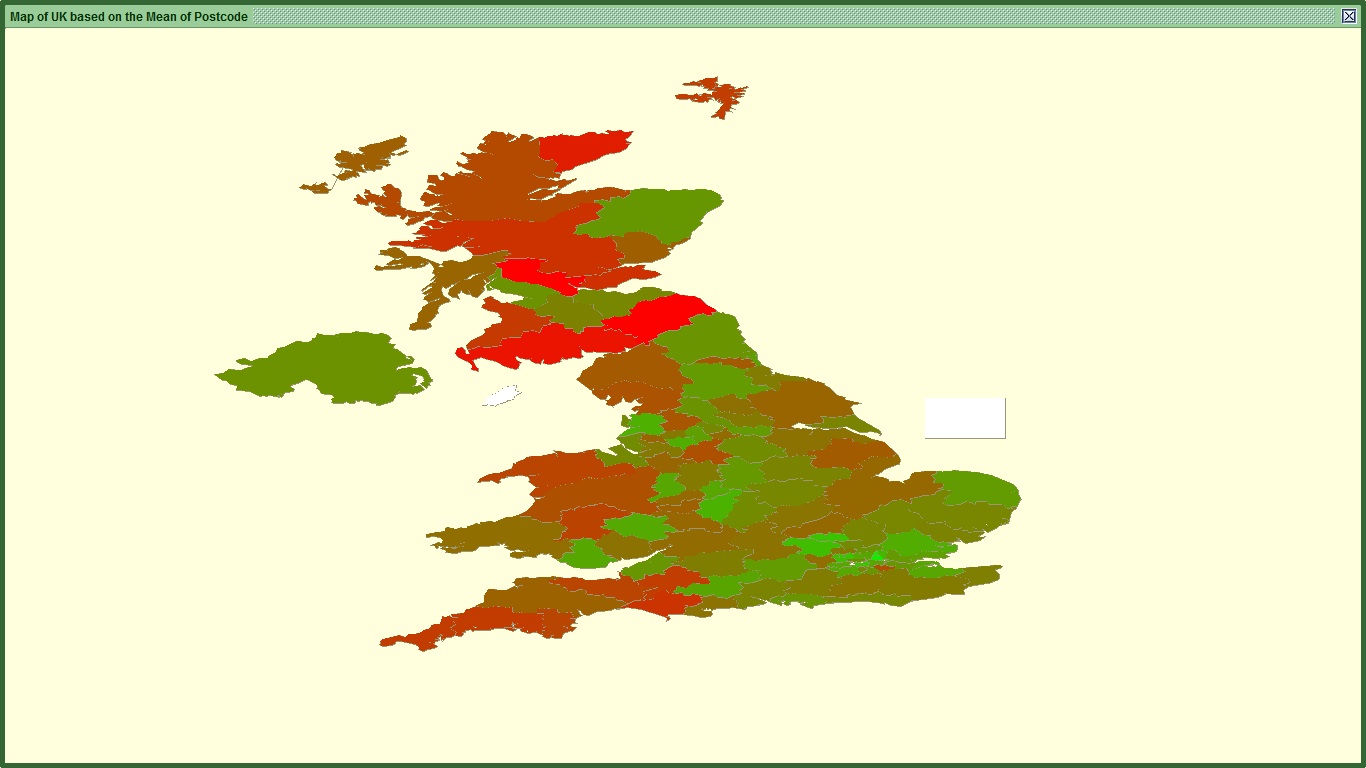
Image:Map of Uk that displays the average age
Finally, close this map and select Income from the right upper column and Sum from the lower left column to see where is the biggest source of income.
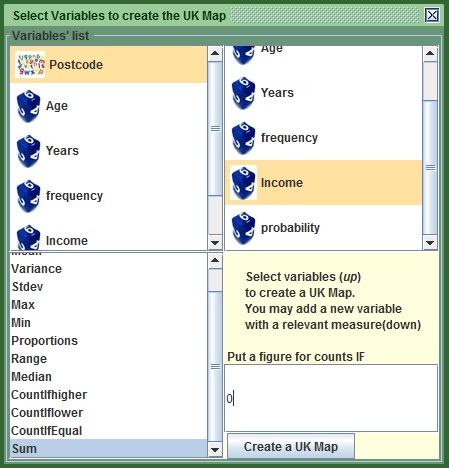
Image:Select income to draw the map
You will notice that the biggest total income of all customers sits in Birmingham (Tax collectors now you know where they are hiding!) … and some in London too!
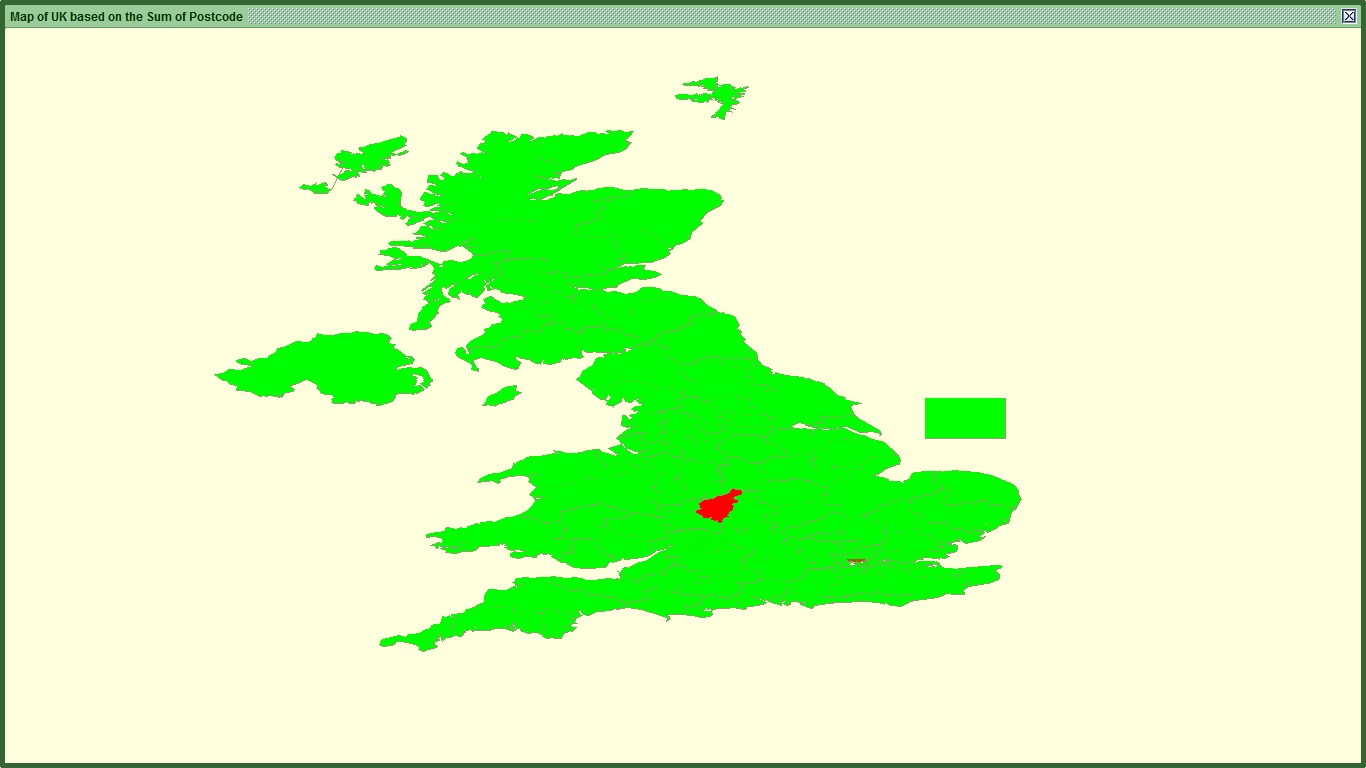
Image:Map of Uk that displays the Sum of income
This tutorial showed you how to make maps with KazAnova Light. You may play yourself with the rest of the variables. Have fun drawing maps! Also if anyone has XY coordinates for other countries'sectors along with a breakdown of the postcodes, I would be more than happy to add it in kazA. Please use the contact form for this or for any other reason in the contact section.