
Get familiar with kazAnova
This section is focused in showing you how kazAnova operates, what is its outlook and generally what are the main elements that it is consisted of as well as important theoretical underpinnings you should be aware of.I hope this section is not too tiring, but it is a necessary evil.
- In the screen that you see in front of you, go to the only existing tab labeled as “File”.
- Choose “Open” and then
 .
. - .txt Tab delimited files (columns are separated by Tab).
- .csv files (comma “,” separated files )
- .xls Excel files of version 1997-2003. In that case it always reads and imports the first in position sheet.
- Find the file “example.txt” and open it. If you have not downloaded it, do so now
Generally KazAnova can import only 3 different types of files at the momment.
The Headings must always be included in the first row no matter what method you are using to import your file. All columns need to have a heading.
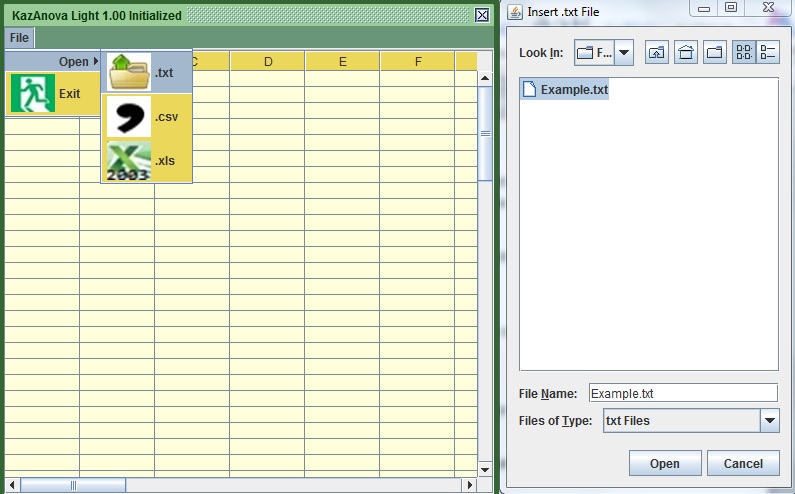
Image: KazAnova's Import Function
Now you should be able to see a couple of variables (columns) starting from “ID” and ending to “Target”. Some of the variables seem to be numeric like ”AGE” and some others appear to be Strings (e.g. to have alphabetic characters) like “REGION”. KazAnona classifies these variables into categories based on a pre-specified logic when importing the file.
Before explaining about the menu Bar, go to the menu “Pre-process” and then select “Manipulate”![]() . You should be able to view a similar window like the one below:
. You should be able to view a similar window like the one below:
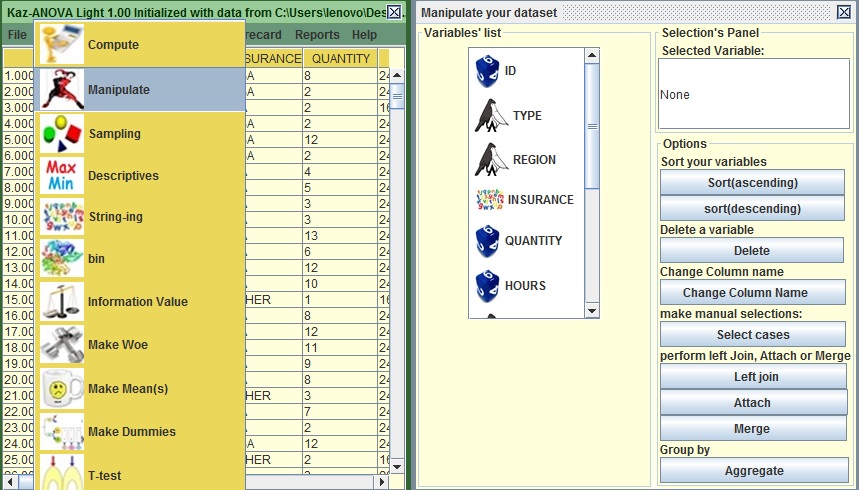
Image: KazAnova's Variable Classification
Take a note of the symbols in the Variables’ list panel. If you scroll down you will see that all your columns (Variables) have a different symbol-icon linked to them. What are these mystical symbols?
So:
- This
 implies that the variable is numeric-it contains only numbers.
 - This
 implies that the Variable is a String; it contains alphabetic characters in some or all the cells.
 - A variable with this
 may be numeric or alphabetic, but it in any case it only has 2 distinct values (Yes or No/ Black or White/ Good or Bad/ Handsome or Ugly etc.).
You should know that kazAnova reads the first 2,000 lines and tries to predict what the variable classification is. In cases of bigger sets, it is possible that the attributed classification is wrong (e.g. the first 2000 lines contain numeric characters, but the 2001 line is wrongly alphabetic, the classification will be numeric). If that happens, do not panic, there are ways to fix it easily but are always indirect. That means you cannot manually change the classification of this variable, but you could create a new one that has the same values (replacing the incorrect ones) but different classification.
Another thing you need to know is that the software understands dot (“.”) as decimal value, NOT Comma (“,”) and this cannot change. However in this tutorial's screenshots you will see it the other way around, but that is only for me! I feel the need to clarify this as where I come from is the other way around. Therefore you need to make certain that all your numeric with decimals variables have dotted decimals (you could easily open the file in notepad and replace comma with dot). Also the software does not understand a thousands’ separator (normally with comma) subsequently you need to avoid that.
Back to the Menu bar you can see the following Tabs:
- File
- Pre-process
- Graphs
- Model
- Scorecard
- Reports
- Help
Starting with the First Tab:
- Go to the “File” Tab that is the most familiar so far and press “Save”
 so as to save the import.
 - Put the name “example_new.txt” (You need to add “.txt” at the end) and press “Save”.
- Go to the directory you saved the file and make certain that it exists.
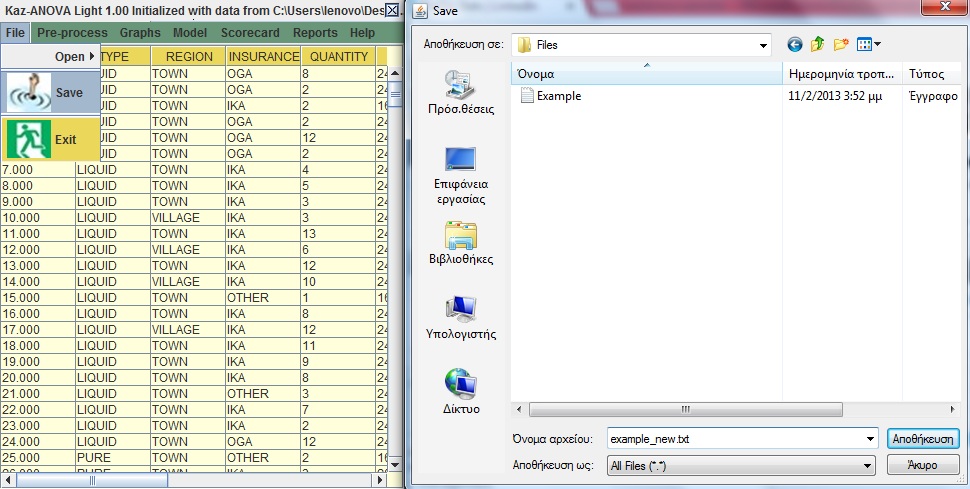
Image: KazAnova's Save Function
If some of the letters in the above frame seem all Greek to you, it is because they are Greek!This process will create a .txt file that is tab delimited. There is no special file for kazAnova, every time you save your work the format will be a tab delimited .txt file that can easily be opened in the same way you imported the current one. Note that every time you save you need to select a name again (you can put the same if you want). This is because there is no “go back” or “go forward” functions in kazAnova and specific actions (e.g. if you sort the file) cannot bring the file back in to its normal state unless you have a previous saved version of it.
A few words about the other tabs:
In my experience I spend over 80% of the modeling time in the pre-process tab and in putting the results together in a nice presentation rather than running the actual modeling algorithm (like regression). In the Pre-process tab generally you can use the following functionalities. You do not need to understand anything right now, I am only displaying it so that it exists somewhere for future reference when you will feel more familiar with the software and you would like to explore more of its functionalities.
- Compute: Derive new Variables
- Manipulate the set: Sort, Join , aggregate, delete columns etc.
- Sample: Split into training and validation sets
- Descriptives: See the Mean, Maximum, Minimum, Variance of numeric variables.
- String-ing: make various stuff with String variables, including binning, concatenation and more.
- Bin: Bin numeric Variables
- Transform Variables: Convert variables using mean or Weights of Evidence or dummy variables.
- Statistical testing: Like Anova , T-test, correlations, IV, I-gain, Gini
- Cross-Tab
The Graph Tab has 4 elements:
- Bar Chart
- Histogram
- Pie Chart
- Scatter plot
The models’ section contains many different statistical algorithms used in prediction and classification problems in a very generic form-a bit unfriendly if you prefer.
The Scorecard Tab (where we play a lot) is more focused in visualizing the results of statistical algorithms and making them easier to interpret and report. It contains scorecards and decision trees of binary or even continuous outcomes.
The Report tab shows the cross tabulation of all the chosen variables versus some binary one . It also displays various statistics regarding the predictiveness (relationship with the variable target) of those variables.
The help function is not actually implemented yet, thus you better pay attention to this tutorial!
That is the end of Tutorial 1. Tutorial 2 will be much more interesting because we will start taking data-related actions.